SOUTH INDIAN
Anais began this basin's season on October 12, 2012. This set a record for the earliest forming category three tropical cyclone in the southwest Indian Ocean. Overall, the number of storms was pretty typical of the basin. Relatively speaking, loss of life and property was low this season.
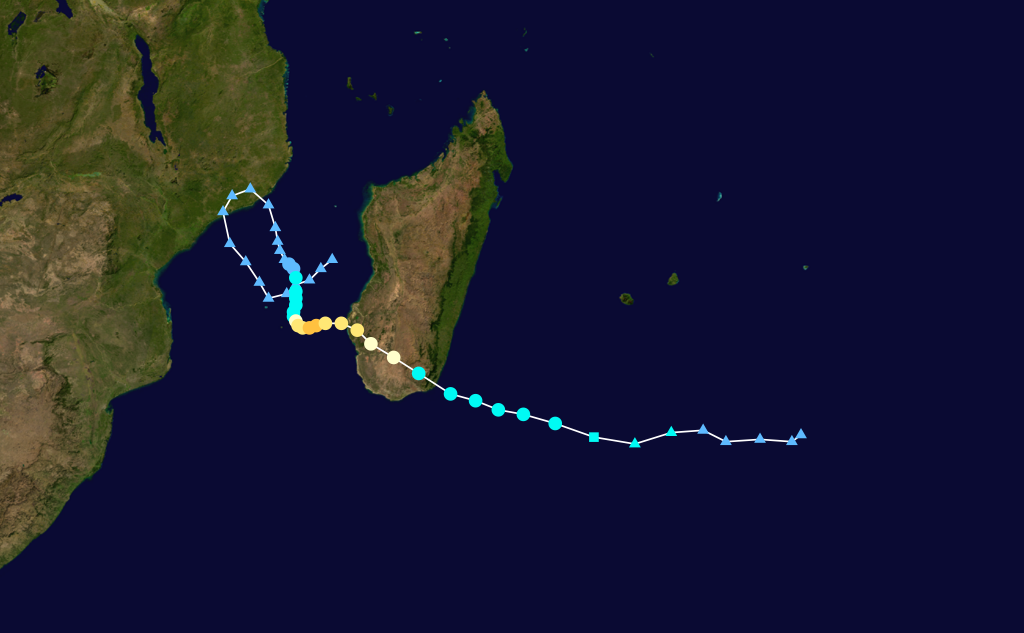
Tropical Cyclone Anais:
October 12 – October 19
SSHWS category: 3
Maximum sustained winds: 110 kts
Minimum central pressure: 941 hPa
Fatalities: 0
Economic damage: $0


Tropical Cyclone Narelle:
5 January – 15 January
SSHWS category: 4
Maximum sustained winds: 115 kts5 January – 15 January
SSHWS category: 4
Minimum central pressure: 937 hPa
Fatalities: 14
Economic damage: $74,000


Narelle caused extensive flooding in Indonesia early in its life, which were the cause of all the fatalities associated with the storm. As it tracked along the west coast of Australia, its moisture helped alleviate severe drought in South Australia.
Tropical Cyclone Felleng:
January 26 – February 3
SSHWS category: 4
January 26 – February 3
SSHWS category: 4
Maximum sustained winds: 115 kts
Minimum central pressure: 937 hPa
Fatalities: 9
Economic damage: $???


Minimum central pressure: 937 hPa
Fatalities: 9
Economic damage: $???
Felleng remained offshore its entire life, but its rainbands produced large areas of flooding in Madagascar destroying nearly 2000 homes. The storm also caused wide spread power outages across Reunion Island.
Tropical Cyclone Haruna:
February 18 – February 24
SSHWS category: 3
February 18 – February 24
SSHWS category: 3
Maximum sustained winds: 100 kts
Minimum central pressure: 948 hPa
Fatalities: 39
Economic damage: $???

Haruna was the deadliest storm of the basin this season. A primary reason for this was it hit southwestern Madagascar, which does not get hit by many tropical cyclones. Nearly 10,000 people were left homeless by Haruna.
Maximum sustained winds: 35 kts
Minimum central pressure: 993 hPa
Fatalities: 6
Economic damage: >$2.5 billion


Oswald was a peculiar storm in that it tracked over land for most of its rather long life. During its life, the storm produced widespread flooding across Queensland.
Maximum sustained winds: 125 kts
Minimum central pressure: 929 hPa
Fatalities: 4
Economic damage: $161 million


Evan was powerful storm with an odd looping track that brought it very close to several major south Pacific islands. Later, its remnants brought heavy rain and high surf to New Zealand.
Maximum sustained winds: 115 kts
Minimum central pressure: 937 hPa
Fatalities: 0
Economic damage: $0


Sandra did not cause any significant damage, despite its strength since it managed to dodge many south Pacific islands. Its remnants made a direct hit on New Zealand, bringing heavy rain and thunderstorms, which helped relieve drought conditions.
NORTH INDIAN
The activity in the North Indian Ocean basin was pretty typical this season, however the intensities of the storms and their impacts were well above average.


NORTH ATLANTIC
The activity in the North Atlantic Ocean basin was absolutely underwhelming. Seasonal forecasts unanimously predicted a very active season. In reality, only two hurricanes formed, the first of which nearly broke the record for the latest forming hurricane on record. The season saw only 435 flight hours made by reconnaissance missions, the lowest since 1966. This season should aid in the accuracy of future forecasts by identifying what went wrong and how to mitigate these factors.


While being steered by a strong subtropical ridge to its north, Chantal set the record for the fastest moving tropical cyclone in the deep tropics at over 25 kts (30 mph or 55km/h).


Short lived Fernand caused significant damage due to flooding and landslides, especially in the Mexican state of Veracruz.


Gabrielle was a highly erratic storm that varied between a tropical depression and a tropical storm many times, as well as regenerating from a remnant low.


One of only two hurricanes this season, Ingrid was also the most destructive. This storm would likely have been significantly stronger if were not for hurricane Manuel, which was tracking along the west coast of Mexico at the time. The outflow from Manuel produced wind shear that hindered Ingrid's growth.
NORTHEAST PACIFIC
Unlike the Atlantic, forecasts called for a below average season in the northeast Pacific basin. These forecasts also proved to be wrong as the season was well above average, especially in the central Pacific region.
Hurricane Barbara:


Barbara was a short lived storm that rapidly intensified into a hurricane shortly before making landfall in southern Mexico. It nearly made it across the country but was determined to have degenerated into a remnant low shortly before entering the Gulf of Mexico.
Typhoon Pewa:


Minimum central pressure: 948 hPa
Fatalities: 39
Economic damage: $???
Haruna was the deadliest storm of the basin this season. A primary reason for this was it hit southwestern Madagascar, which does not get hit by many tropical cyclones. Nearly 10,000 people were left homeless by Haruna.
SOUTH PACIFIC
The south Pacific basin had a somewhat below average year as far as the number of storms is concerned. There were however, a few storms that had significant impacts.
Tropical Storm Oswald:
17 January – 29 January
SSHWS category: NA
17 January – 29 January
SSHWS category: NA
Minimum central pressure: 993 hPa
Fatalities: 6
Economic damage: >$2.5 billion
Tropical Cyclone Evan:
December 9 – December 19
SSHWS category: 4
December 9 – December 19
SSHWS category: 4
Minimum central pressure: 929 hPa
Fatalities: 4
Economic damage: $161 million
Tropical Cyclone Sandra:
March 5 – March 14
SSHWS category: 4
SSHWS category: 4
Minimum central pressure: 937 hPa
Fatalities: 0
Economic damage: $0
Sandra did not cause any significant damage, despite its strength since it managed to dodge many south Pacific islands. Its remnants made a direct hit on New Zealand, bringing heavy rain and thunderstorms, which helped relieve drought conditions.
Tropical Storm Mahasen:
May 10 – May 17
SSHWS category: NA
May 10 – May 17
SSHWS category: NA
Maximum sustained winds: 50 kts
Minimum central pressure: 990 hPa
Fatalities: 107
Economic damage: >$5.14 million


The rain associated with Mahasen resulted in loss of life and property all around the Bay of Bengal, from Indonesia to Sri Lanka. An important note is that many of the fatalities occurred while people were evacuating, most notably due to over crowded ferries. Mahasen was the second deadliest storm of the year in this basin.
Minimum central pressure: 990 hPa
Fatalities: 107
Economic damage: >$5.14 million
The rain associated with Mahasen resulted in loss of life and property all around the Bay of Bengal, from Indonesia to Sri Lanka. An important note is that many of the fatalities occurred while people were evacuating, most notably due to over crowded ferries. Mahasen was the second deadliest storm of the year in this basin.
Cyclone Phailin:
October 9 – October 14
SSHWS category: 5
October 9 – October 14
SSHWS category: 5
Maximum sustained winds: 140 kts
Minimum central pressure: 918 hPa
Fatalities: 45
Economic damage: $696 million


Phailin was the big outlier in this basin with winds nearly twice as strong as the second strongest storm. Tropical cyclones in the Bay of Bengal have a tendency to be extraordinarily deadly, so it was feared that the death toll of Phailin could be in the tens of thousands, or even higher. Miraculously, due to effective evacuation procedures in India and sheer good luck, only 45 people died from this storm.
Minimum central pressure: 918 hPa
Fatalities: 45
Economic damage: $696 million
Phailin was the big outlier in this basin with winds nearly twice as strong as the second strongest storm. Tropical cyclones in the Bay of Bengal have a tendency to be extraordinarily deadly, so it was feared that the death toll of Phailin could be in the tens of thousands, or even higher. Miraculously, due to effective evacuation procedures in India and sheer good luck, only 45 people died from this storm.
Tropical Storm 03A (2013 Somalia Cyclone):
November 8 – November 11
SSHWS category: NA
November 8 – November 11
SSHWS category: NA
Maximum sustained winds: 40 kts
Minimum central pressure: 1002 hPa
Fatalities: 140
Economic damage: $???
Minimum central pressure: 1002 hPa
Fatalities: 140
Economic damage: $???
Tropical Storm 03A was the deadliest storm in the basin and tied for Somalia's deadliest cyclone on record. Most of the damage was due to extensive flooding caused by heavy rain and the storm's slow movement.
Tropical Storm Helen:
November 19 – November 22
SSHWS category: NA
November 19 – November 22
SSHWS category: NA
Maximum sustained winds: 60 kts
Minimum central pressure: 990 hPa
Fatalities: 11
Economic damage: $800 million
Minimum central pressure: 990 hPa
Fatalities: 11
Economic damage: $800 million
Helen was the costliest storm in the basin this year and one of several to strike India towards the end of the season.
Tropical Storm Chantal:
July 7 – July 10
SSHWS category: NA
July 7 – July 10
SSHWS category: NA
Maximum sustained winds: 55 kts
Minimum central pressure: 1005 hPa
Fatalities: 1
Economic damage: $10 million
Minimum central pressure: 1005 hPa
Fatalities: 1
Economic damage: $10 million
While being steered by a strong subtropical ridge to its north, Chantal set the record for the fastest moving tropical cyclone in the deep tropics at over 25 kts (30 mph or 55km/h).
Tropical Storm Fernand:
August 25 – August 26
SSHWS category: NA
SSHWS category: NA
Maximum sustained winds: 50 kts
Minimum central pressure: 1001 hPa
Fatalities: 14
Economic damage: $??? million
Minimum central pressure: 1001 hPa
Fatalities: 14
Economic damage: $??? million
Short lived Fernand caused significant damage due to flooding and landslides, especially in the Mexican state of Veracruz.
Tropical Storm Gabrielle:
September 4 – September 13
SSHWS category: NA
September 4 – September 13
SSHWS category: NA
Maximum sustained winds: 55 kts
Minimum central pressure: 1003 hPa
Fatalities: 0
Economic damage: $0
Minimum central pressure: 1003 hPa
Fatalities: 0
Economic damage: $0
Gabrielle was a highly erratic storm that varied between a tropical depression and a tropical storm many times, as well as regenerating from a remnant low.
Hurricane Ingrid:
September 12 – September 17
SSHWS category: 1
September 12 – September 17
SSHWS category: 1
Maximum sustained winds: 75 kts
Minimum central pressure: 983 hPa
Fatalities: 23
Economic damage: $1.5 billion
Minimum central pressure: 983 hPa
Fatalities: 23
Economic damage: $1.5 billion
One of only two hurricanes this season, Ingrid was also the most destructive. This storm would likely have been significantly stronger if were not for hurricane Manuel, which was tracking along the west coast of Mexico at the time. The outflow from Manuel produced wind shear that hindered Ingrid's growth.
NORTHEAST PACIFIC
Unlike the Atlantic, forecasts called for a below average season in the northeast Pacific basin. These forecasts also proved to be wrong as the season was well above average, especially in the central Pacific region.
May 28 – May 30
SSHWS category: 1
SSHWS category: 1
Maximum sustained winds: 65 kts
Minimum central pressure: 983 hPa
Fatalities: 5
Economic damage: $1 million
Minimum central pressure: 983 hPa
Fatalities: 5
Economic damage: $1 million
Barbara was a short lived storm that rapidly intensified into a hurricane shortly before making landfall in southern Mexico. It nearly made it across the country but was determined to have degenerated into a remnant low shortly before entering the Gulf of Mexico.
Typhoon Pewa:
August 16 – August 26
SSHWS category: 1
SSHWS category: 1
Maximum sustained winds: 65 kts
Minimum central pressure: 990 hPa
Fatalities: 0
Economic damage: $0
Minimum central pressure: 990 hPa
Fatalities: 0
Economic damage: $0
Pewa was the first named storm to form in the central Pacific since 2010. After crossing the 180th meridian, the storm strengthened and was briefly classified as a typhoon by the JTWC.
Tropical Storm Ivo:
August 16 – August 26
SSHWS category: NA
August 16 – August 26
SSHWS category: NA
Maximum sustained winds: 40 kts
Minimum central pressure: 997 hPa
Fatalities: 1
Economic damage: $300 thousand
Minimum central pressure: 997 hPa
Fatalities: 1
Economic damage: $300 thousand
As Ivo made its way northward toward the Baja California Peninsula, an upper level low over the western United States drew in moisture from the storm. This contributed to flooding, flash flooding, and mudslides.
Hurricane Manuel:
September 13 – September 19
SSHWS category: 1
September 13 – September 19
SSHWS category: 1
Maximum sustained winds: 65 kts
Minimum central pressure: 985 hPa
Fatalities: 169
Economic damage: $4.2 billion
Minimum central pressure: 985 hPa
Fatalities: 169
Economic damage: $4.2 billion
Manuel made two landfalls in Mexico and produced severe flooding all along its track. Worst hit were the cities of Acapulco and Chilpancingo. Numerous landslides isolated, or partially isolated, several small towns.
NORTHWEST PACIFIC
This basin was yet another that suffered from highly incorrect seasonal forecast. The official forecast was for 2013 to have a relatively average typhoon season; instead it was the most active year since the beginning of the modern satellite era (1979) with 31 named storms.
Typhoon Fitow:
September 29 – October 7
SSHWS category: 2
September 29 – October 7
SSHWS category: 2
Maximum sustained winds: 90 kts
Minimum central pressure: 956 hPa
Fatalities: 11
Economic damage: $10.4 billion
Minimum central pressure: 956 hPa
Fatalities: 11
Economic damage: $10.4 billion
Fitow track took through the southern Japanese islands, just off the coast of Taiwan, and a direct strike on central China. The damage in China, both from flooding and high winds, was especially severe.
Typhoon Wipha:
October 9 – October 16
SSHWS category: 4
October 9 – October 16
SSHWS category: 4
Maximum sustained winds: 115 kts
Minimum central pressure: 930 hPa
Fatalities: 41
Economic damage: $100 million
Minimum central pressure: 930 hPa
Fatalities: 41
Economic damage: $100 million
Wipha was responsible for extensive damage to islands surrounding the Japanese mainland. It also caused large amounts of contaminated water to be released from the Fukushima Daiichi nuclear power plant. In the wake of the storm massive increases in radiation was measured even outside of the levees surrounding the plant.
Super Typhoons Francisco and Lekima:
October 15 – October 26 and October 19 - October 26
SSHWS category: 5
October 15 – October 26 and October 19 - October 26
SSHWS category: 5
Maximum sustained winds: 140 kts
Minimum central pressure: 918 hPa
Fatalities: 0
Economic damage: $0
Minimum central pressure: 918 hPa
Fatalities: 0
Economic damage: $0
Super Typhoon Francisco
Super Typhoon Lekima
I list Francisco and Lekima as one entry since they had the same maximum winds, minimum pressure, relatively parallel tracks, neither did any significant damage, and they existed at the same time. The lack of any real damage is quite amazing given the storms' strength and relatively large sizes.
Tropical Storm 30W:
October 1 – November 22
SSHWS category: TS
October 1 – November 22
SSHWS category: TS
Maximum sustained winds: 35 kts
Minimum central pressure: 996 hPa
Fatalities: 13
Economic damage: minor
Minimum central pressure: 996 hPa
Fatalities: 13
Economic damage: minor
30W is probably the longest lived tropical cyclone of the 2013 season. It began being monitored well east of the Philippines and reached tropical strength in the South China Sea, it survived tracking across Southeast Asia and regained tropical storm strength in the Bay of Bengal. After crossing southern India it slowly weakened until finally dissipating just off the coast of Africa.
Super Typhoon Haiyan:
November 3 – November 11
SSHWS category: 5
November 3 – November 11
SSHWS category: 5
Maximum sustained winds: 170 kts
Minimum central pressure: 895 hPa
Fatalities: >6,241
Economic damage: >$1.5 billion
Minimum central pressure: 895 hPa
Fatalities: >6,241
Economic damage: >$1.5 billion
Haiyan was by far the deadliest tropical cyclone of the 2013 season and the deadliest storm on record to impact the Philippines. The storm also broke the record for the highest wind speed at landfall, surpassing Hurricane Camille of 1969, and is unofficially the strongest storm on record in terms of wind speed. To compound the destruction is the fact that the region had suffered a strong earthquake less than a month earlier. After making a total of six landfalls in the Philippines, Haiyan crossed the South China Sea and made two more landfalls in China and Vietnam, albeit as a much weaker storm.
No comments:
Post a Comment