Each
day, around the world, countless television stations, newspapers, weather
agencies, and web sites issue weather maps depicting the current weather
conditions or those forecast for the day. These might look something like this:

This happens
to be a rather historic storm from November 1998. What is likely most prominent
on this map, as well as most other weather maps, are the large “H”s and “L”s
and the bold colored lines. These symbols depict the weather based as described
by a model developed in the 1920s by the Bergen School in Norway. This model,
called the Norwegian Polar Front Cyclone Model, describes the process in which
mid-latitude cyclones (MLC) begin, develop, and ultimately dissipate. The key
characteristic of this theory is the dominance of fronts, especially the cold
front. The fronts envisioned here were unlike any standard model of the day;
the idea that strong temperature gradients could exist over long distances had
typically been dismissed. Below is a weather map issued by the Signal Service
of the U.S. Army back in September of 1872:
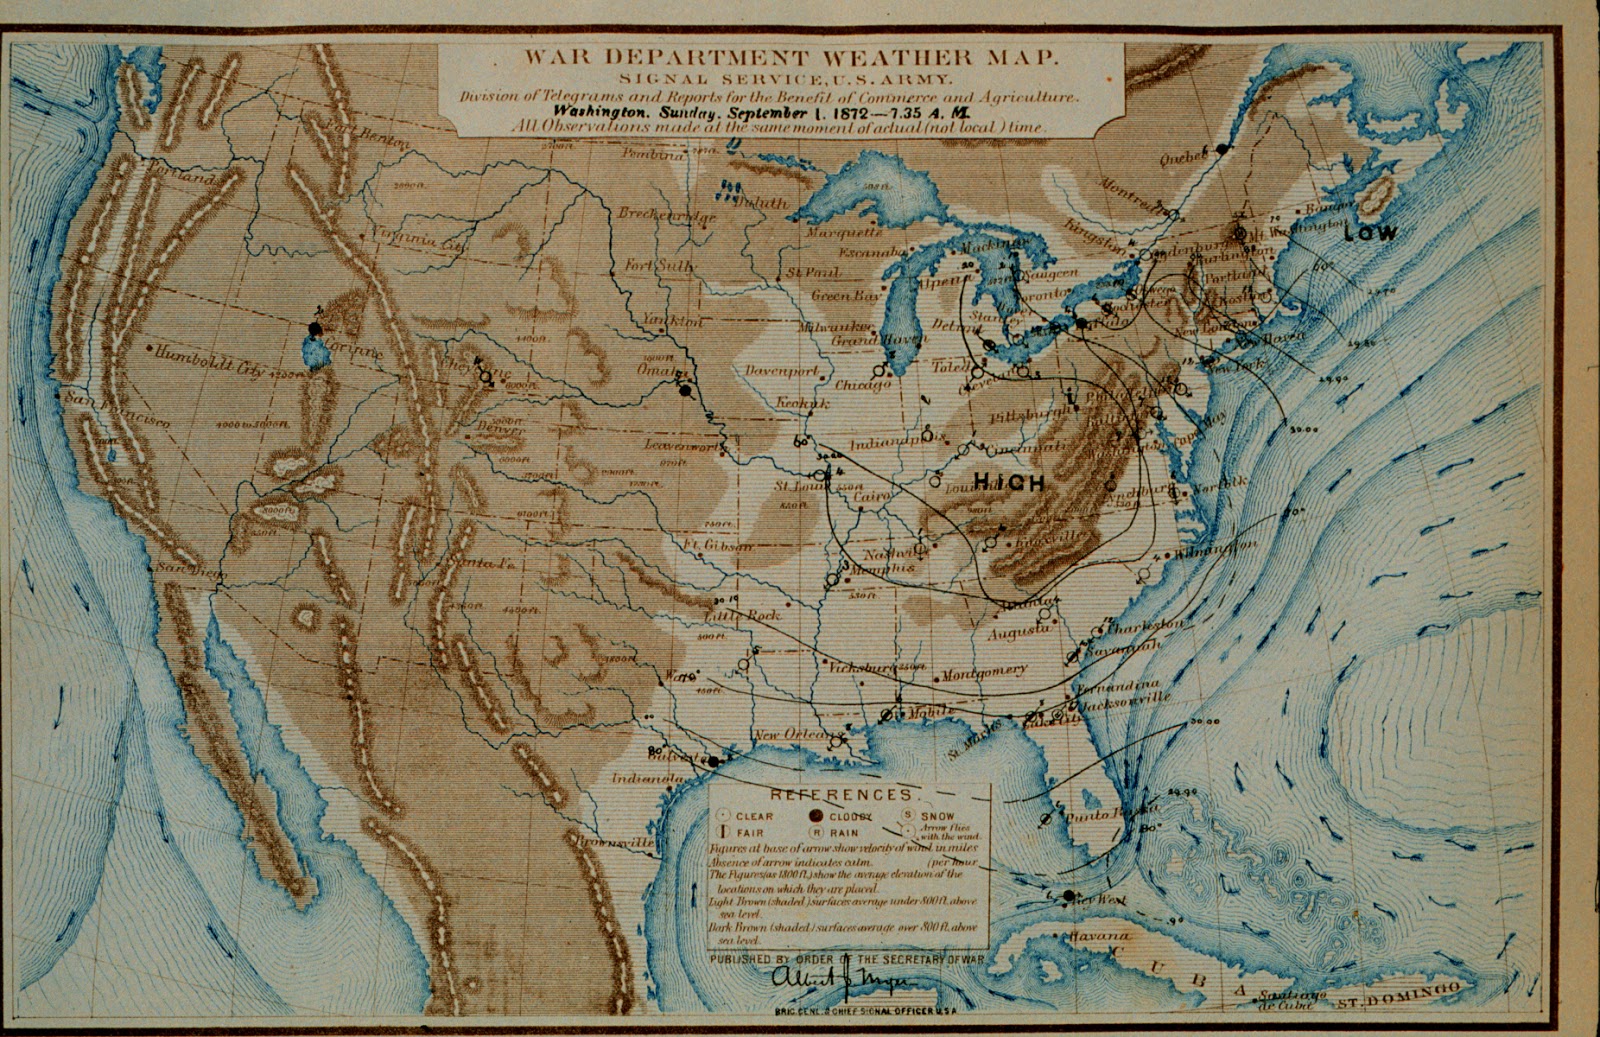
First of
all, the lack of observations over the western part of the country is
immediately apparent. The black lines are isobars or isotherms (lines of
constant temperature), depending on what they’re labeled as. On this map, a
high pressure center is depicted over much of the Appalachian Mountains and a
low center is identified just off the coast of Maine. Nowhere on this map are
fronts, or even strong temperature gradients, despite the fact that it is likely
that there was at least a weak cold front right off the east coast.
 |
| "Frontal Wave" |
The Norwegian model fixed many of these issues
and was able to describe how the specific features came about. The MLC in their
theory begins along what they called the “polar front”, which they envisioned
as a zone of high temperature gradient that circles the earth in the mid-latitudes.
These days, this would likely be shown as a stationary front located over
places as far north as central Canada, Western Europe and Siberia. To some
extent this front does show up, but only in sections. In the model, it is along
this polar front that a weak low pressure center develops. This center will
begin to cause the surrounding air to spiral cyclonically (counter-clockwise),
thus pulling warm air from the south northward and pushing cold air from the
north southward. At this point, the system is referred to as a “frontal wave”.
 |
| Fronts |
As this
trend continues, the polar front will be twisted cyclonically. Since the cold
air moving southward on the west side of the system is denser than the
northward flow of warm air, it essentially plows into the warm air, forcing it
to rise above the cold air. The edge of this cold air mass is the cold front,
while the warm air moving northward will eventually have to slide up the cold
air north of the system, forming the warm front.
 |
| Developing |
At this
stage in development the fronts become well established and both circulate
around the low center cyclonically. The overall appearance of the system is
relatively unchanged, except that the cold front, which circulates faster than
the warm front, is beginning to “catch up” to the warm front, causing the angle
between them to decrease.
 |
| Mature |
In the
final stage, the MLC is fully mature and is likely at its peak intensity. The
cold front has caught up with the warm front and past the point where they
intersect the front is now an occluded front, which combined look something
like a zipper on a jacket. Since the occlusion began, the warm air from the
south has no longer reached the low center. Eventually the lack of warm air will
weaken the low center and cause its pressure to increase, or “fill”.
Cross-sections
of the three front types helps show what the air masses are doing in three dimensions.
The warm
front is characterized a warm air mass that is sliding up the cooler air mass
to the north, which is likely slowly retreating. It is the line on the ground
where the two air masses meet that a surface warm front is depicted. Since the
air gently slides up the cool air, clouds associated with warm fronts tend to
be layer clouds with light precipitation. It is common for places on the
surface in the cool air to receive precipitation from the clouds forming on the
warm front far above the surface.
The cold
front is a zone of sharp contrast where the cold, dense air mass moving
southward is pushing into the warm air mass. The warm air is forced to rapidly ascend
the front of the cold air, resulting in a zone of cloudiness that is much
thinner than around the warm front, but with much more vigorous precipitation
or even thunder storms. Because the advancing cold air is pushing into the warm
air, often the warmest area of a MLC will be right in front of the cold front.

The
occluded front is sort of a combination of the warm and cold fronts. Since
the dense cold air catches up to the warm front, the warm front is essentially
lifted up the face of the cold front. The result is that at the surface the
occluded front represents the boundary between the cold air that was behind the
cold front and the slightly less cold air that was ahead of the warm front. Now
the only place where the warm air can be found is aloft, above where the three
fronts meet.

No comments:
Post a Comment